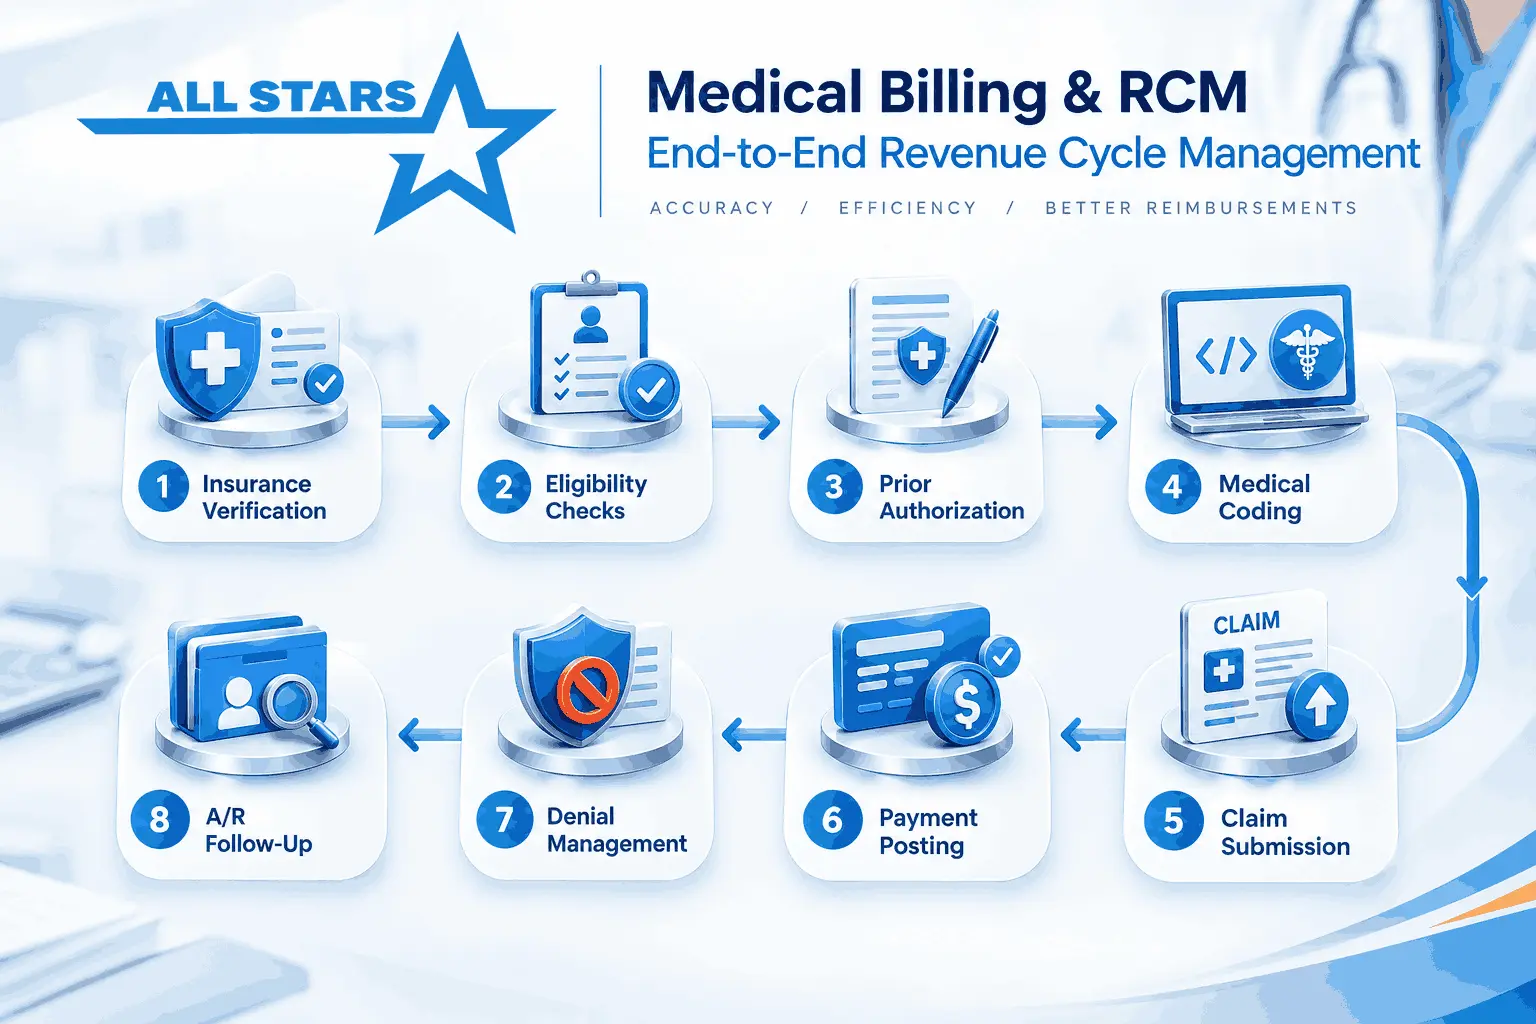

The mere presence of a packed appointment schedule does not necessarily mean healthy financial results. The number of patients that you see is not always associated with good income since the following issues can cause revenue loss long before becoming apparent:
- missed charges,
- denied claims,
- delayed payments,
- aged receivables,
- underpayments.
This is the reason why the KPIs related to medical billing become so significant. Medical billing KPIs help you measure and analyze the results of your billing processes on the basis of objective data rather than feelings.
Below you will find the list of 15 most relevant healthcare billing KPIs for 2026, their importance and calculations.
What Are Medical Billing KPIs?
Medical Billing KPIs are quantitative measures used to evaluate the efficiency of the overall process of the revenue cycle of a medical facility, starting from the time when a patient comes in for services and ending when payment is made for those services.

Clean Claim Rate
The proportion of claims that have been accepted by the payer upon initial submission, without any errors in coding, patient demographic, insurance information, or authorizations.
Calculation: (Number of Clean Claims / Total Number of Claims Submitted) x 100
Example: 950 out of 1,000 accepted = 95% clean claim rate. The higher the rate, the better.
2. Claim Denial Rate
Measures how often submitted claims are denied by payers.
Formula: Denied Claims ÷ Total Adjudicated Claims × 100
Denials often originate upstream, in eligibility checks, authorizations, or documentation, not just in the billing office. Tracking denial trends by category exposes recurring root causes.
3. Net Collection Rate
Shows how effectively a practice collects the reimbursement it’s contractually owed, after adjustments.
Formula: Payments ÷ (Charges − Contractual Adjustments) × 100
This is a more accurate performance indicator than gross charges, since it reflects negotiated payer rates rather than list prices.
4. Days in Accounts Receivable (A/R)
Estimates how many days’ worth of revenue is currently tied up in unpaid claims and balances. Lower is generally better, and this figure is most useful when segmented by payer, provider, or location rather than viewed as one blended average.
5. A/R Aging
Breaks outstanding balances into time-based buckets:
- 0–30 days
- 31–60 days
- 61–90 days
- 91–120 days
- 120+ days
Older balances carry more risk and may be nearing payer appeal deadlines, so this report helps prioritize collection efforts.
6. Percentage of A/R Over 90 Days
Isolates the highest-risk portion of outstanding receivables.
Formula: A/R Over 90 Days ÷ Total A/R × 100
A rising percentage often signals unresolved denials, slow payer response times, or follow-up gaps.
7. Average Reimbursement Time
Tracks how long it takes, on average, for a claim to move from submission to payment.
Formula: Total Days from Submission to Payment ÷ Number of Paid Claims
Segmenting this by payer often reveals which insurers are slowest to reimburse.
8. First-Pass Resolution Rate
Measures how many claims are resolved successfully without correction, resubmission, or appeal. A strong rate here reflects healthy coordination between registration, coding, authorization, and submission workflows.
9. Charge Capture Rate
Tracks whether every billable service actually gets entered and submitted for reimbursement. A practice can bill accurately on submitted claims and still lose revenue if services never make it into the system.
10. Payment Posting Accuracy
Measures whether payments, adjustments, and remaining balances are recorded correctly. Inaccurate posting distorts A/R totals, generates wrong patient statements, and skews financial reporting.
11. Underpayment Rate
Occurs when a payer reimburses less than the contracted or expected amount.
Formula: Underpaid Claims ÷ Claims Reviewed × 100
These are easy to miss since the claim technically got paid, but small shortfalls add up fast at volume.
12. Patient Collection Rate
Measures how effectively a practice collects patient-owed balances. As patient financial responsibility rises industry-wide, this metric depends heavily on clear communication, accurate cost estimates, timely statements, and flexible payment options.
13. Prior Authorization Denial Rate
Tracks claims denied due to missing, incorrect, or expired authorization. Since these issues originate before the visit happens, this metric often points to gaps in scheduling or verification workflows.
14. Appeal Success Rate
Measures how often appealed claims result in payment.
Formula: Successful Appeals ÷ Total Appeals Submitted × 100
Not every denial is worth appealing this Medical Billing KPIs shows which denial categories are actually worth the resource investment.
15. Revenue Cycle Cost to Collect
Compares Medical Billing KPIs total operating spend (staffing, coding, technology, clearinghouse fees, outsourced billing) against revenue collected. Collections shouldn’t be judged in isolation from what it costs to generate them.
Why Unpaid Claims Deserve Active Management, Not a Backlog Mentality
An unpaid claim represents revenue already earned but not yet converted to cash. Each one has a specific cause pending payer review, an eligibility mismatch, missing documentation, or a denial tied to coding. Treating these as routine backlog rather than active work items lets real money slip away. Evaluating each claim by status, payer rules, dollar value, and age then acting on it is what protects revenue.
Building a Medical Billing KPIs Dashboard
| Revenue Cycle Area | KPIs to Monitor |
|---|---|
| Front-End | Eligibility accuracy, authorization issues, charge capture |
| Claim Submission | Clean claim rate, first-pass resolution |
| Denials | Denial rate, denial categories, appeal success |
| Accounts Receivable | Days in A/R, A/R aging, A/R over 90 days |
| Payments | Net collection rate, reimbursement time, posting accuracy |
| Patient Revenue | Patient collection rate, outstanding balances |
| Payer Performance | Underpayments, payment delays, denial trends |
| Overall Efficiency | Cost to collect, revenue recovery |
The goal isn’t tracking the most metrics it’s answering three questions: Where is revenue being lost? Why is it happening? What should happen next?
What is the most important medical billing KPI?
There’s no single “most important” KPI clean claim rate, denial rate, and net collection rate together give the clearest picture of revenue cycle health, since each catches problems at a different stage of the billing process.
What is a good clean claim rate?
Most well-performing practices aim for 90–95% or higher. Rates consistently below that suggest front-end data entry, eligibility, or coding issues worth investigating.
How often should practices review Medical Billing KPIs?
Monthly reviews are standard for most metrics, with weekly monitoring recommended for denial rates and A/R aging, since these change quickly and compound if left unaddressed.
What’s the difference between gross collection rate and net collection rate?
Gross collection rate compares payments to total charges (list price), while net collection rate compares payments to the contractually adjusted amount actually owed, making net collection rate the more accurate performance measure.
How AllStars Can Help Optimize Your Revenue Cycle Medical Billing KPIs
Revenue cycle performance for U.S. healthcare organizations cannot be about making claims and receiving payment anymore.
AllStars Medical Billing & IT Services offers comprehensive Medical billing KPIs and revenue cycle management solutions tailored to help you optimize your billing, claims handling, denial handling, A/R monitoring, and general revenue performance.
Our solutions can assist you in achieving better results in such areas as:
Medical Billing & RCM
Medical Coding
Eligibility & Benefit Verifications
Authorization
Credentialing
Claims Processing
Denials Management & Appeals
Posting
A/R Management & Recovery
Patient Billing
EDI & Clearinghouse Management
Billing Audits & Performance Review
Using appropriate processes, reports, and revenue cycle management tools, your organization can take its revenue cycle from simply accounting the numbers to making sense of the story behind them.
Are you ready to get better visibility into your medical billing process?
Go to AllStars Medical Billing & IT Services to find out how our medical billing and revenue cycle management services can help your organization develop its efficient, measurable, and financially disciplined revenue cycle.